The main window of QSE contains a series of separate pages controlling the steps of the data analysis. Broadly speaking, you will move through the pages in sequence when analysing data.
The Settings Page
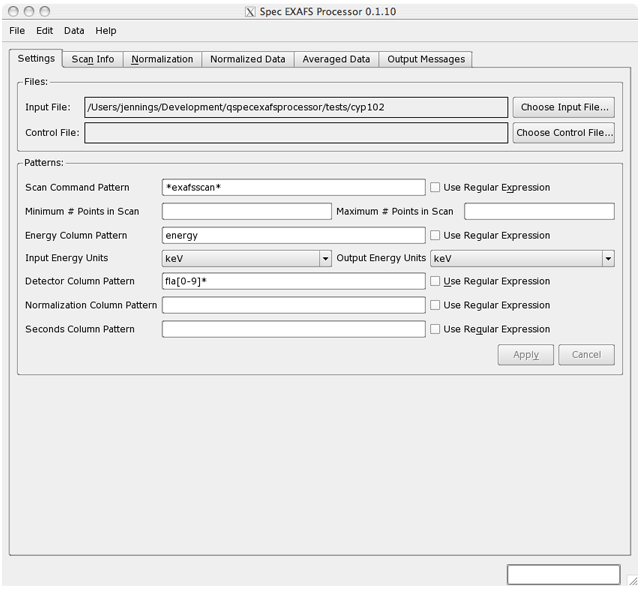
From the 'Settings' page you can choose files to load and you can specify 'patterns' which will be matched to the scan names and column names to determine which scans and data columns to process. The patterns are 'wildcard' style patterns by default but advanced users may wish to specify regular expression patterns instead. When you change any of the parameters in the 'Patterns' section the 'Apply' and 'Cancel' buttons will become active. Click 'Apply' to match the patterns against the input data.
To perform a normalization you will need to identify a single column to use as the X axis, a set of columns which will be added together as detector channels and (optionally) a set of columns which will be added together and used as a normalization signal or a single column which will be used as the counting time.
The patterns are matched against the entire scan command or column name and the matching is always case insensitive. For wildcard-style matching, the '?' character will match any single character, the '*' character will match any sequence of characters and square brackets '[' & ']' are used to match any single character from a set enclosed by the brackets.
The Scan Info Page
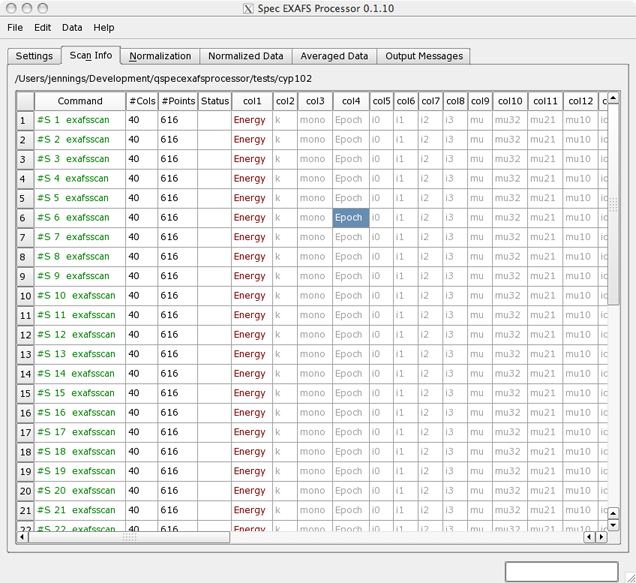
The 'Scan Info' page contains a table showing all the scans which have been loaded together with the names of all the data columns that they contain. The table cells are color coded to show how the data will be processed. The scan command is colored green if the scan is selected and grey if not. Column names are colored red if the column is the energy, green if it is a detector channel, cyan if it is a normalization channel and magenta if it is the counting time.
You can override the defaults for a scan (or scans) by selecting cells from the 'Command' column and right-clicking on a selected cell. You will then get a context menu with three choices: 'Revert scan(s) to default usage', 'Do not use scan(s)' and 'Use scan(s)'. Scans which have been overridden in this way will be displayed with a light gray background.
Similarly you can override the defaults for a column (or group of columns) by selecting cells from the column names section of the table. Right click on a selected cell to get a context menu of options to change the usage of the selected data column(s) in the selected scan(s). As before, cells wich have been overridden will be displayed with a light gray background.
The Normalization Page
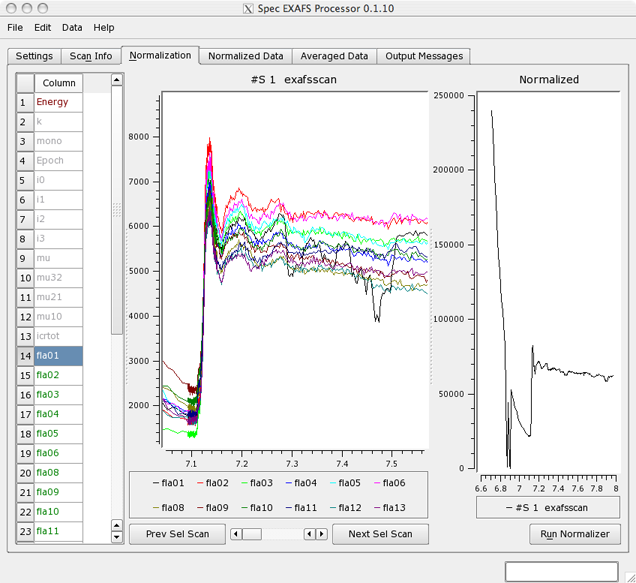
The 'Normalization' page contains graphs showing details of the normalization performed on an individual scan. The page is split horizontally into three panes which can be re-sized by dragging in the boundaries between sections and can be hidden by dragging the corresponding border completely down to size 0.
The left hand pane shows a list of the data columns present in the scan, color coded in the same way as in the 'Scan Info' page. You can override the defaults for a data column by selecting cells and right clicking in the same way as for the 'Scan Info' page.
The middle pane shows a graph of the detector data columns from the current scan. You can zoom the graph by dragging a rectangular region with the left mouse button, unzoom by <CTRL>-clicking. Middle-click and drag to 'pan' the graph display. Right click in the graph to get a context menu with commands "Autoscale Graph", "Print Graph..." and "Display/Hide Legend". With the legend displayed you can click on the individual legend entries to highlight the individual curves in the graph.
Below the graph is a row of three controls, the "Prev Sel Scan" button, a scrollbar, and the "Next Sel Scan" button. These are used to control which of the scans in the input data set is to be displayed. The scroll bar may be used to rapidly step through the input scans - regardless of whether the corresponding scan is selected, while pressing the buttons will step through only the selected scans.
The right hand pane shows the result of normalizing the current scan. It supports the same mouse operations and context menu commands as the previous graph.
Below the normalized data graph is a single button "Run Normalizer". When you click this then all the selected scans in the input data set will be individually normalized and the results placed in the next page - the 'Normalized Data' page.
The Normalized Data Page
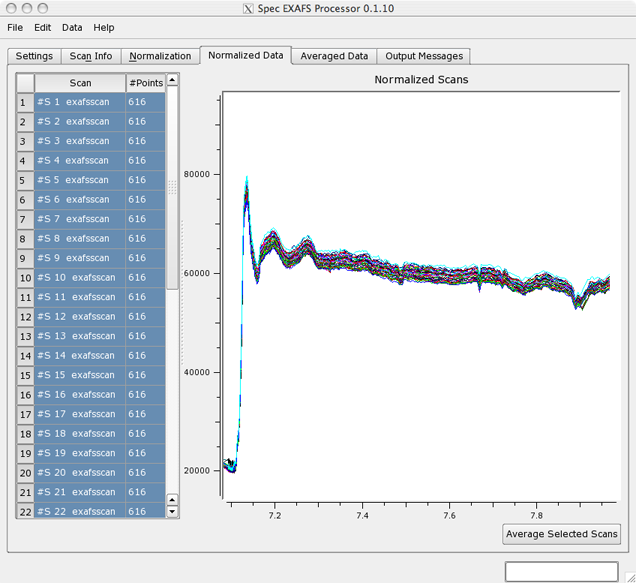
The 'Normalized Data' page is where you can review the results of normalizing the input scans. It is split horizontally into two resizable panes. Each time the 'Normalizer' command is run the previous normalized scans are removed before the normalizations are performed.
The left hand pane shows a list of the normalized scans. You can select one or several scans here and they will be shown in the right hand pane. The graph pane supports the usual mouse options as well as the additional context menu commands "Average Selected Scans", "Save Selected Scans" and "Remove Selected Scans" - these commands are also available by right clicking selected cells in the left hand pane - and there is also an "Average Selected Scans" button beneath the graph.
Choose "Average Selected Scans" to calculate the average of the selected scans and append the resulting scan to the next page - the "Averaged Data" page. The set of scans to be averaged should all have the same X axis values and the same number of data points.
Choose "Save Selected Scans" to write out the data in the selected scans into output files. A file selection dialog will open where you can enter an output file name - each scan will then be written into a separate file whose name is got by inserting the scan number into the file name that you entered.
Choose "Remove Selected Scans" to delete the selected scans from the normalized data set.
The Averaged Data Page
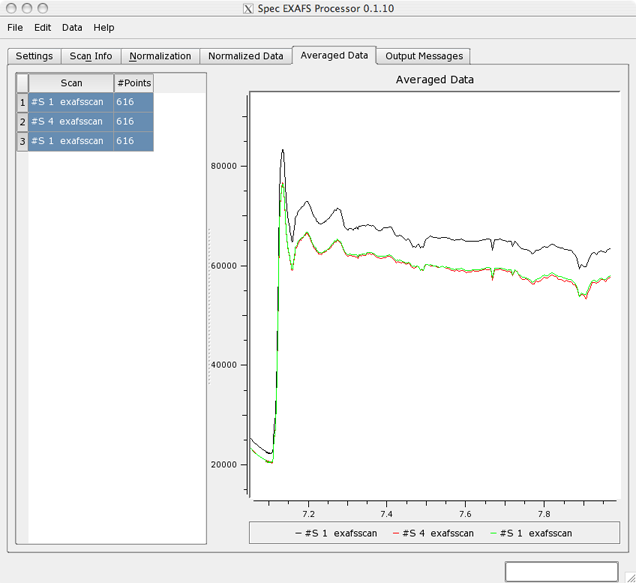
The 'Averaged Data' page is where you can review the results of averaging scans. This page behaves similarly to the 'Normalized Data' page except that the data is not automatically removed before each averaging operation and the "Average Selected Scans" command is not present.
The Output Messages Page

This page provides a scrolling record of messages produced by the program. You can select ranges of text and there is a context menu which allows you to copy the selected text to the clipboard.
 1.8.6
1.8.6